|
1 2 3 4 |
Let's say you have a server in a LAN you want to monitor from your house or from your office instead of being in a depressing computer room. By the way, computer rooms are not depressing at all, we all love them! ;)! But if you have multiple servers? Thinking the possibillities working mobile? Enough! <strong><span style="font-size: x-large;">GKrellM features</span></strong> |
|
1 |
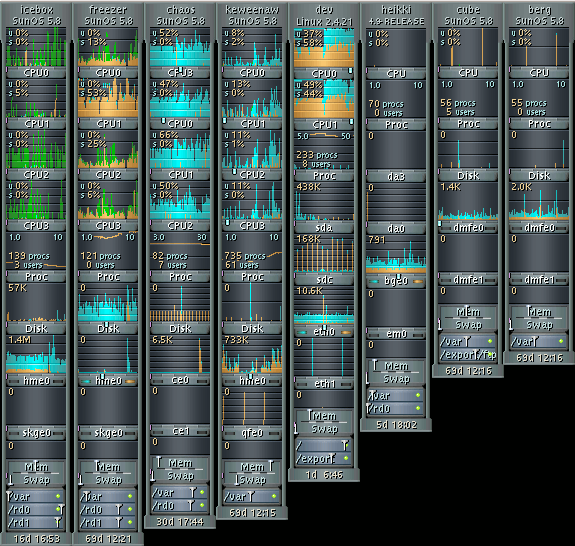
<a href="http://gkrellm.net/">GKrellM</a> is a free monitoring tool that gives you information about: |
- Hostname/systemname display.
- Clock/calendar.
- SMP CPU monitor that can chart individual CPUs and/or a composite CPU.
- Temperature, fan, and voltage sensor monitors if supported by the kernel and the mainboard hardware. Linux requires lm_sensors modules, sysfs sensors for kernels >= 2.6.0 or a running mbmon daemon. Sensors can also be read from mbmon on FreeBSD. On Linux, you can also monitor disk temperatures from the ddtemp daemon and nvidia GPU temperatures if nvidia-settings is installed. Each sensor monitor has a configurable alarm and warning.
- Process monitor with a chart for load and forks and a display of number of current processes and users.
- Disk monitor that can chart individual disks or a composite disk.
- Internet monitor (http, ftp, …) that displays current tcp port connections and charts historical port hits for over two days.
- Net interface monitors with charts for all routed net interfaces. Data rx/tx LEDs and a timer button that can be linked to a ppp or isdn net interface and displays on line time.
- Memory and swap space usage meters, and a swap page in/out chart.
- File system meters which show capacity/free space and can mount/umount.
- A mailbox monitor which can launch a mail reader, a mail fetch/check program, and a sound notify command. Builtin new mail message checking for mbox, maildir, MH, POP3, and IMAP mailboxes.
- APM laptop battery meter with a configurable alarm and warning for low battery time left.
- Uptime display.
- Multiple monitors managed by a single process to reduce system load.
- Charts have auto scaling or fixed scaling modes.
- Commands can be configured to run when monitor labels are clicked.
- gkrellm can run in client mode and collect data from a gkrellmd server running on a remote machine.
- Both gkrellm and the gkrellmd server are plugin capable so special interest monitors can be coded.
|
1 |
<strong><span style="font-size: x-large;">GKrellM installation</span></strong> |
|
1 2 3 |
1. First of all you must have physical or via <a href="https://totallynoob.comHow-to-setup-SSH-Install-SSH-server-and-client" target="_blank">ssh</a>access to the machine you want to monitor. So, login to the machine [crayon-679041f7e74a1031723904 lang="bash" ]ssh username@remote-address-of-the-machine |
2. For ubuntu or debian type
|
1 |
apt-get install gkrellmd to install gkrellm-server. |
Config file exists at /etc/gkrellmd.conf in case you want to change something later. Note that if you change anything in config file you must restart gkrellm deamon with service gkrellmd restart in order to apply the new configuration. 3. Create a tunnel over SSH
|
1 |
ssh -N -f -L 19150:127.0.0.1:19150 user@address-of-the-machine |
Note: If you installed the gkrellmd via ssh open another terminal and type the obove command. Note2: The first number is your local port. In case you want to monitor multiple computers you have to change it to another available port.Check it with
|
1 |
netstat -nt |
4. Run
|
1 |
gkrellm -s 127.0.0.1 -P 19150 |
By this command you are saying to gkrellm to listen from localhost on 19150 (local) port which is directly receives data from your ssh tunnel.
Note: If you want to monitor multiple servers you can run the first command and change the first port to the next available port on your local machine, then you can run the second command but change the first port to the same port of the previous command.[/crayon]
Specktator.


